The AI Energy Surge: How Tech Giants Navigated Sustainability in 2025 & 2026
The rapid acceleration of artificial intelligence has transformed every corner of technology, but its heavy demand for compute power has created unprecedented tension between hyper-growth and environmental stewardship.
In their latest 2026 Sustainability Reports covering 2025 operational performance, Google, Amazon / AWS, and Microsoft laid out clear proof of this reality: while energy efficiency and clean power procurement reached record highs, the sheer scale of data center expansions drove operational and supply chain emissions upward across the board.
Here is an analysis of how the tech industry’s largest infrastructure players fared, the challenges they face, and how they plan to reconcile AI's growing energy appetite with their long-term climate goals.
1. Google: Decoupling Growth with AI Stack Efficiency & Next-Gen Energy
Google's 2026 Environmental Report highlights a high-stakes balance between massive load growth and decarbonization innovation.
Key Performance Metrics & Progress
Grid Load Growth: Google navigated its largest load growth in history—a 37% annual increase in electricity demand in 2025.
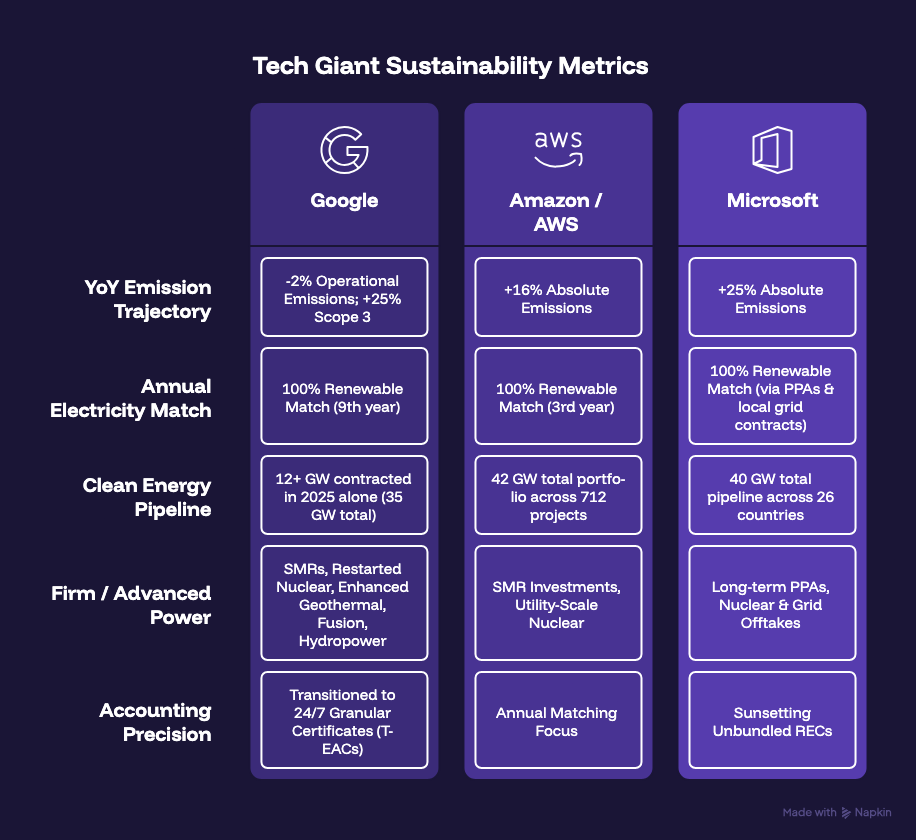
Emissions Performance: Despite this surge, Google successfully reduced its operational (Scope 1 & Scope 2 market-based) emissions by 2% year-over-year, and has cut emissions per gigawatt-hour (GWh) by 47% since 2019. However, Scope 3 supply chain emissions grew by 25% due to Asia-Pacific grid constraints and infrastructure expansion.
Renewable Energy & Procurement: Matched 100% of global electricity consumption with renewable purchases for the ninth consecutive year. In 2025 alone, Google contracted for a record 12+ GW of net-new clean energy.
Water Stewardship: Consumed 10.9 billion gallons of water across data centers and offices. Replenished 7.7 billion gallons (78% of freshwater consumption) through 165 community watershed projects
Key Breakthroughs & Strategy
AI Stack Efficiency: Google lowered Gemini serving unit costs by 78% in 2025. Over a 12-month period, the energy footprint and total carbon footprint of the median Gemini Apps text prompt dropped by 33x and 44x, respectively.
Custom Hardware: Launched 7th-Gen Ironwood TPUs, offering a 3.7x improvement in Compute Carbon Intensity over previous generations. 8th-Gen TPUs deliver up to 2x performance-per-watt over Ironwood.
Firm & Breakthrough Clean Energy: Announced collaborations to restart Iowa’s Duane Arnold Energy Center (600 MW nuclear power expected online in 2029), broke ground on Kairos Power SMR deployments, approved 115 MW of enhanced geothermal in Nevada, and signed the largest direct corporate purchase agreement for fusion energy (200 MW with Commonwealth Fusion Systems).
Grid Integration: Integrated over 1 GW of demand response capacity into U.S. utility contracts to shift or limit machine learning workloads during peak grid stress.
2. Amazon / AWS: Heavy Capacity Expansion Meets Clean Energy Milestones
Amazon’s latest sustainability report documents the sheer volume of infrastructure added to support cloud workloads and AI demand, alongside major logistics decarbonization.
Key Performance Metrics & Progress
Emissions Trend: Absolute carbon emissions increased 16% in 2025. Direct (Scope 1) emissions grew 2%, Scope 2 jumped 34%, and Scope 3 rose 20%.
Carbon Intensity: Despite absolute increases, carbon intensity dropped 38% compared to a 2019 baseline, even as revenue grew 156% over the same period.
Capacity Additions: Amazon added more global data center capacity in 2025 than any other provider, including over 1.2 GW of capacity in Q4 alone.
Renewable Energy Match: Reached its 100% renewable energy match goal for all global operations for the third consecutive year—achieved five years ahead of its original 2030 target.
Key Breakthroughs & Strategy
Portfolio Scale: Accumulated 712 total renewable energy projects globally representing over 42 GW of clean energy capacity.
Water Efficiency: Achieved a Data Center Water Usage Effectiveness (WUE) of 0.12 L/kWh—a 20% improvement from 2024. Returned 9.4 billion liters of water to communities via active replenishment projects toward its 2030 water positive goal.
Logistics & Packaging: Deployed over 52,700 electric delivery vans on the road and reduced per-unit shipping waste by 5%.
3. Microsoft: Infrastructure Scaling Drives Carbon Challenges
Microsoft’s environmental disclosures highlight the direct clash between rapid AI deployment and strict carbon removal and reporting standards.
Key Performance Metrics & Progress
Emissions Trend: Total greenhouse gas emissions rose 25% year-over-year in FY2025 to 20.29 million metric tons of \(CO_2e\). Total emissions are up roughly 23.4% compared to its 2020 baseline.
Scope Breakdown: Scope 2 emissions jumped significantly—accounting for 13% of total emissions (up from 2% in FY2024).
Accounting Shift: A major factor behind the Scope 2 jump was Microsoft's decision to sunset the use of unbundled, non-additional Renewable Energy Certificates (RECs), choosing instead to evaluate progress on real-world additions.
Key Breakthroughs & Strategy
Renewable Commitments: Expanded its global power purchase agreement (PPA) portfolio to over 40 GW across 26 countries to supply future data centers with carbon-free electricity.
Carbon Removal Leadership: Contracted for over 45 million metric tons of carbon removal across 29 distinct projects and 10 removal pathways.
Water Replenishment: Achieved key water replenishment milestones in FY2025 as part of its goal to become water positive by 2030.
Comparative Overview: How They Stack Up
Key Industry Takeaways
AI Acceleration Vs. Grid Decarbonization: The rate of data center expansion continues to outpace the rate at which local energy grids are decarbonizing. Infrastructure growth in regions heavily reliant on fossil fuels (such as Asia-Pacific) remains the single largest driver of Scope 3 supply chain emissions.
The End of "Paper" Decarbonization: Hyperscalers are stepping away from unbundled RECs and simple annual offsets. The industry is shifting toward Granular Certificates (T-EACs) and hourly, location-based matching to ensure clean power is delivered to the exact grid at the exact hour it is consumed.
The Clean Firm Power Pivot: Intermittent wind and solar are no longer enough to power around-the-clock AI workloads. Google, Amazon, and Microsoft are all investing in baseload "clean firm" capacity—spanning SMR nuclear deployments, geothermal, advanced battery storage, and fusion.
Hardware and Software Efficiency as First-Line Defense: Because physical grid upgrades take years, chip-level efficiency (such as Google’s TPUs and AWS’s custom silicon) and algorithmic optimizations are proving to be the fastest way to curb energy demand growth.