In the previous post, we have seen how to collect the system metrics using Telegraf and send them to InfluxDB and visualize them in Grafana.
In this post, we will see how to download those system metrics as Excel report using NodeJS application and link them with Grafana.
If you don’t have time to read but want to know what’s there in this post. Find the quick read 👇

In Grafana OSS(Open Source) we can’t download the reports in PDF or Excel format. but there are few plugins available for PDF which would take a snapshot of the panels.
But to download the report as excel we don’t have any option all we have is to download panel data as CSV.
Today, we are going to see how to download the data collected by InfluxDB as an excel report in Grafana using NodeJS.

Overall Flow
What we are going to do
In this series, we will see how to download the system metrics data which is stored in InfluxDB from Grafana using the NodeJS application.

Milestones
Create a telegraf configuration to collect system metrics
Run the telegraf agent to send system metrics
Create a Dashboard in Grafana for system metrics using InfluxDB as a data source
Create a Node.js application to collect system metrics from InfluxDB using client libraries
Create the Excel report using the collected metrics
Configure Grafana to download the report
What we are going to do in Part 2
In this part, we will see how to
Create a Node.js application to collect system metrics from InfluxDB using client libraries
Create the Excel report using the collected metrics
Configure Grafana to download the report

1. Create a Node.js application to collect system metrics from InfluxDB using client libraries
Let’s see how to create a Node.js application to collect system metrics from InfluxDB using InfluxDB client libraries.
If you haven’t installed Node.js and npm on your machine kindly do it by clicking the below button 👇
Once you have installed Node.js and npm create a new folder and do npm init and answer the questions asked.
Once the npm init is completed install the below libraries using npm install command
@influxdata/influxdb-client
exceljs
express
moment
moment-relativism
Once the above packages are installed create the following files
index.js
constants.js
env.js
cpuUsage.js
generateWorkbook.js
Now open the index.js file and copy the snippets from the below image 👇
index.js
In the index.js file, we have received the request from Grafana with the date parameters and these parameters are passed to getCPUUsage() where the data from InfluxDB are queried using the InfluxDB client library.
Now open the constants.js file and add the below snippets
Now open the env.js file and add the below snippets. Once you have copied it open your InfluxDB and get the token, organization name, and bucket name.
Open cpuUsage.js file and copy the below snippets 👇
In the above snippet, we have collected the CPU usage metrics from InfluxDB using the client library. You can take the above snippet as a reference and can collect data for other metrics
Now we have done the basic setup of Gathering data from InfluxDB using the InfluxDB Client library. Now we will convert the data we got to excel

2. Create the Excel report using the collected metrics
Open the generateWorkBook.js file and copy the below snippets 👇
In the above snippet, we have sent the data collected from InfluxDB and then those data’s are added to the sheet.
Now we have written all the codes that are needed to collect the metrics from InfluxDB and convert them into excel format.
Now run the Node.js application using the command node index.js
3. Configure Grafana to download the report
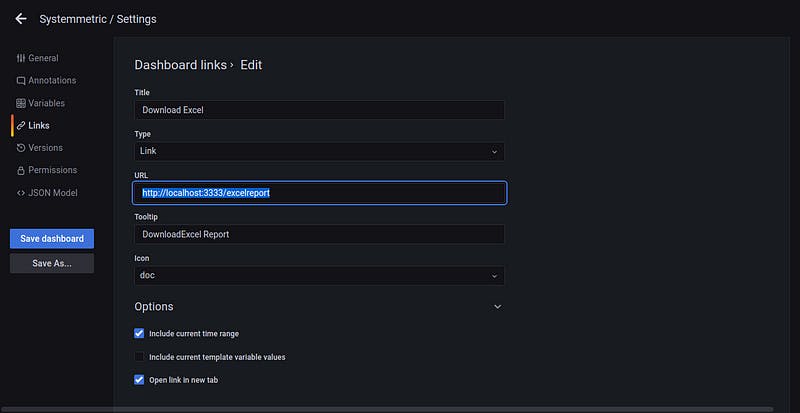
Now open your local Grafana server and then click Settings -> Link
Create a new Link like below 👇

Grafana Link
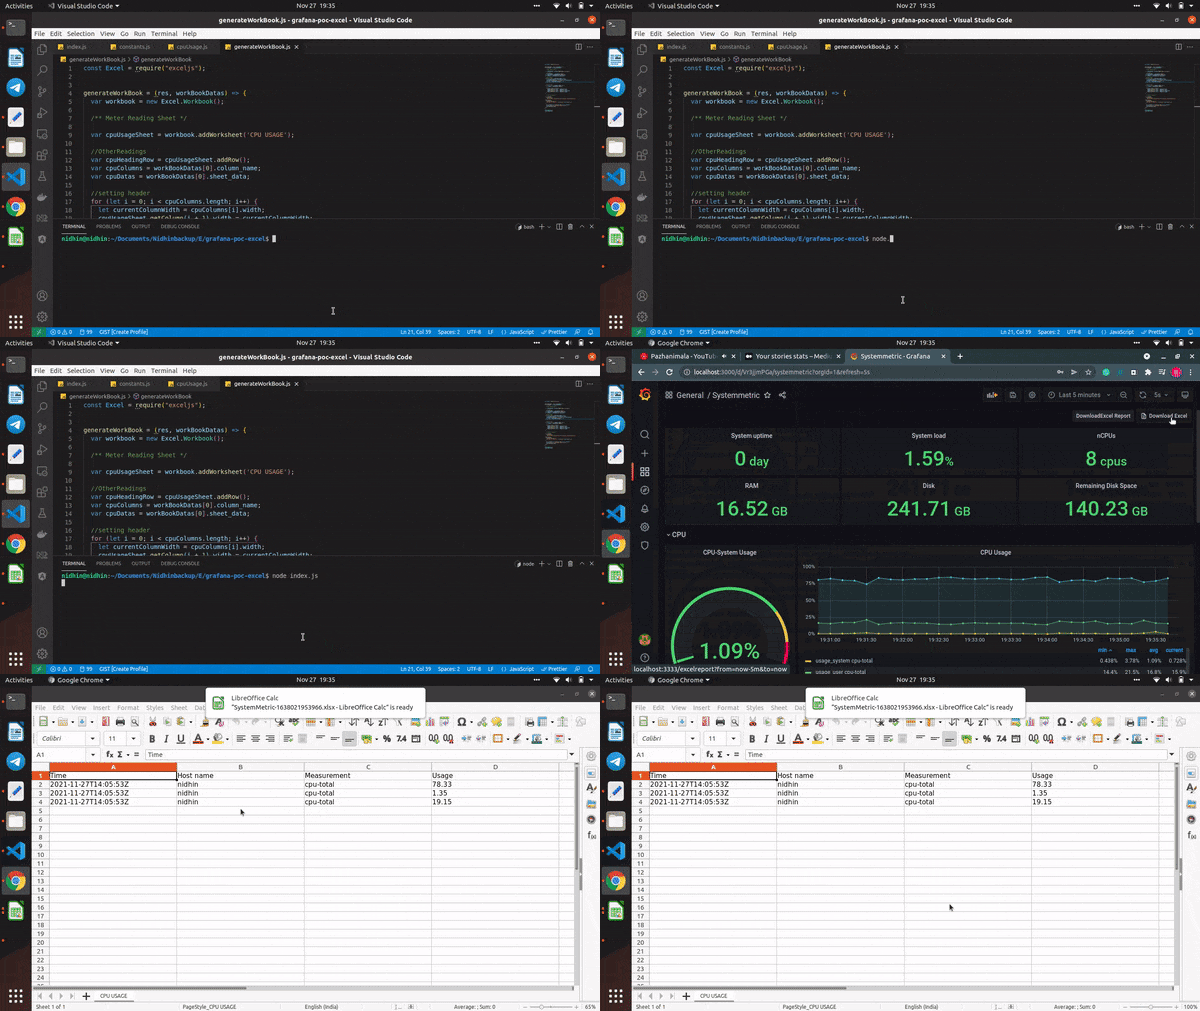
Click Save Dashboard and then navigate to your dashboard where you can see the download excel button. Click the download button now you could see an output like below

Downloading Excel Report in Grafana
Feel free to grab the entire code down here 👇
Download Source Code
Congratulations 🏆

You have learned how to download excel report from Grafana using Node.js. application. Catch you up in a new post. Till then Happy Learning 😄


