Loki installation in Ubuntu

In this post, we will see how to install Loki and Promtail in Ubuntu to visualize the logs in Grafana. But before that, we will see what is Loki and why we need it.
Source: Nidhinkumar
What we are going to do

A quick look at what we are going to do
What is Loki
Why do we need Loki
Loki Stack
After that, let’s get our hand’s dirty by installing

Let’s start the installation
4. Loki in Ubuntu
5. Promtail in Ubuntu
And finally, we start to
6. Visualize the logs in Grafana

Visualize logs in Grafana
Let’s Start

#1-Didyouknow
1. What is Loki
Loki is a horizontally scalable, highly available, multi-tenant log aggregation system. It is designed to be very cost-effective and easy to operate.

Horizontally-scalable
It doesn’t index the contents of the logs but rather a set of labels for each log stream. Log data itself can be compressed in chunks in object stores such as S3 or GCS, or even in the local file system. A small index and highly compressed chunks can simplify the operation as well as lower the cost.

#2-Didyouknow
2. Why do we need Loki
Comparing to other log aggregation systems Loki
Doesn’t do full-text indexing on logs they would index only on metadata which makes it easier to operate and cheaper to run
It is a good fit for storing Kubernetes Pod logs. Metadata such as pod labels is automatically scrapped and indexed
It has native support with Grafana

#3-Didyouknow
3. Loki Stack
Loki based logging stack consists of 3 components

Loki Stack
Promtail — Agent responsible for gathering logs, and sending them to Loki
Loki — Main server, responsible for storing logs and processing queries
Grafana — Querying and displaying logs
Now we have seen the basics of Loki, let’s start with the installation now

Installation on Loki
4. Loki in Ubuntu
Navigate to the release page and then scroll down to the assets section and select the latest version and download the .zip file

Warning
Once the zip file is downloaded create a new directory named of your own choice :) and then unzip the Loki binary to the newly-created directory.
Now we will download the config file for Loki from the below link. Open the terminal in the directory where you have unzipped Loki and then copy the below command to download the config file
wget https://raw.githubusercontent.com/grafana/loki/v2.2.1/cmd/loki/loki-local-config.yaml
Don’t worry just copy the below steps to install Loki (#Ninja Mode :)
$ curl -O -L "https://github.com/grafana/loki/releases/download/v2.2.1/loki-linux-amd64.zip"
# extract the binary
$ unzip "loki-linux-amd64.zip"
# make sure it is executable
$ chmod a+x "loki-linux-amd64"
# download config file
$ wget https://raw.githubusercontent.com/grafana/loki/v2.2.1/cmd/loki/loki-local-config.yaml

#4-Didyouknow
once done we can proceed to the Promtail installation.
5. Promtail in Ubuntu
Navigate to the release page and then scroll down to the assets section and select the latest version of Promtail and download the .zip file.
Once the zip file is downloaded extract the Promtail binary to the directory which you have created during Loki installation.
Now we will download the config file for Promtail from the below link. Open the terminal in the directory where you have unzipped Loki and then copy the below command to download the config file
wget https://raw.githubusercontent.com/grafana/loki/v2.2.1/cmd/promtail/promtail-local-config.yaml
Don’t worry just copy the below steps to install Promtail (#Ninja Mode :)
$ curl -O -L "https://github.com/grafana/loki/releases/download/v2.2.1/promtail-linux-amd64.zip"
# extract the binary
$ unzip "promtail-linux-amd64.zip"
# make sure it is executable
$ chmod a+x "promtail-linux-amd64"
# download config file
$ wget https://raw.githubusercontent.com/grafana/loki/v2.2.1/cmd/promtail/promtail-local-config.yaml

#5-Didyouknow
We have completed the installation of Loki as well as Promtail and started them in the local machine. Let’s make some changes in the Grafana to view the logs.
6. Visualize the logs in Grafana
Open Grafana (if it doesn’t open check whether the Grafana-server is running or not)
If the Grafana server is not running run using the below command(Linux based system)
sudo service grafana-server start
Once Grafana is running click Settings->Datasource and then click Add Datasource and then select Loki

Grafana-Datasource
Once the data source is added click Loki again

Grafana-Loki Configuration
Now add the URL as your localhost with port number 3100

Loki Configuration
Now the Loki setup in Grafana is completed.

#6-Didyouknow
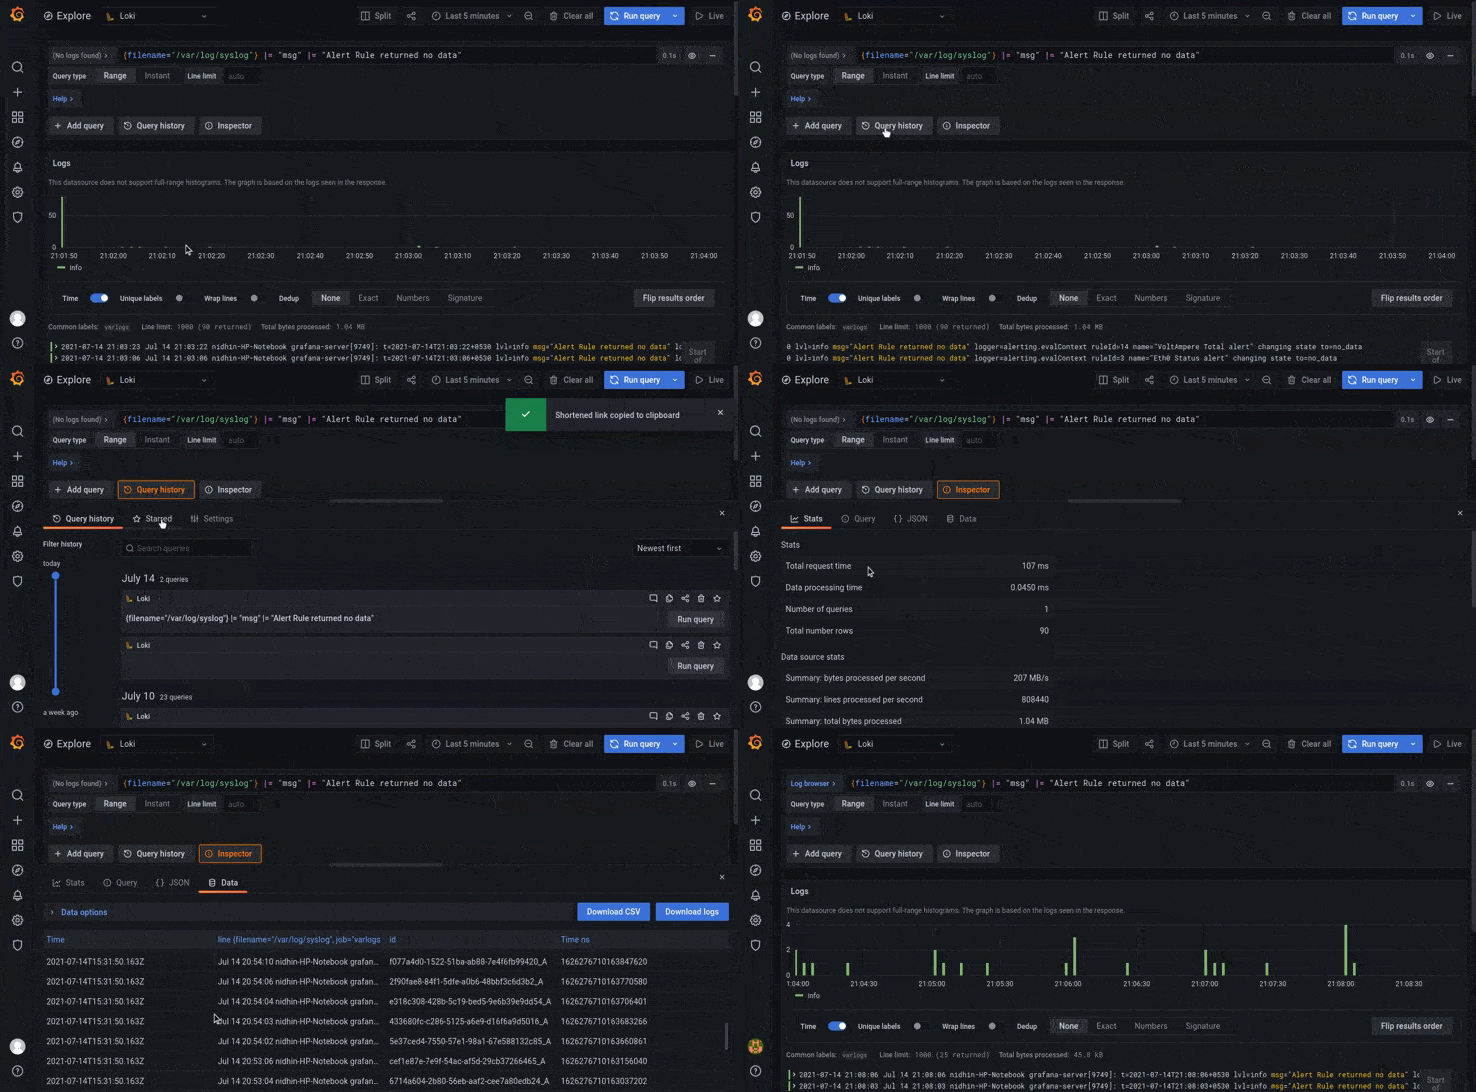
Let us explore some logs using Loki in Grafana. Now click Explore which will open the explore tab and then select Loki in the drop-down which will open the Loki Panel where we can write the LogQL queries.
Add the below query in Loki query input box to view the logs
{filename="/var/log/syslog"} |= "msg" |= "Alert Rule returned no data"
Once the query is added click run which will show an output like below

LogQL-Query#1
You can view the Query history by clicking the Query history button

LogQL-QueryHistory
You can click the inspector to view Stats, Query, JSON, and Data like below
LogQL
Now we will write some queries to filter the logs
{filename="/var/log/syslog"} |= "msg" |= "Alert Rule returned no data"
The above query will filter the logs which has the msg “Alert Rule returned no data”
And similarly to get the number of count for a particular msg in a given time interval we would use the below query
count_over_time(({filename="/var/log/syslog"} |= "msg" |= "Alert Rule returned no data"[$__interval]))
Similarly, we can try other queries to extract data from the logs.
Grab the LogQL cheatsheet 📖 to know more about LogQL.

Loki Cheatsheet
Congratulations! 🏆
You have learned how to install Loki in Ubuntu and learned how to query the logs in Loki using LogQL.You can play around with LogQL.
Catch you up in a new post till then Happy Learning!
Comments
Join the discussionNo comments yet. Be the first to comment.