InfluxDB (TICK Stack) — Part2

Source: Nidhinkumar
Overview
In the previous post, we have seen what is Time-series database, what is TICK stack, how to install TICK Stack in both local and VM instances, and visualized the system metrics in Chronograf.
In this post, we will write our own plugin which will collect metrics from Youtube
Objectives
Intro about Telegraf Plugin Architecture
Download GoLang and clone the Telegraf repository
Create a custom Telegraf input plugin to collect Youtube Statistics
Create a dashboard to visualize the Youtube statistics
Create a dropdown menu to change the values dynamically
1. Intro about Telegraf Plugin Architecture
Telegraf is a server-based agent that collects metrics from inputs-applications, databases, message queues, and more.
Telegraf’s plugin driven architecture and lightweight footprint doesn’t require external dependencies like npm, pip, or gem which makes it a popular tool for collecting metrics from a variety of input sources.
Telegraf is a compiled Go executable and all plugins are compiled directly into the build, which means you don’t want to install any plugins
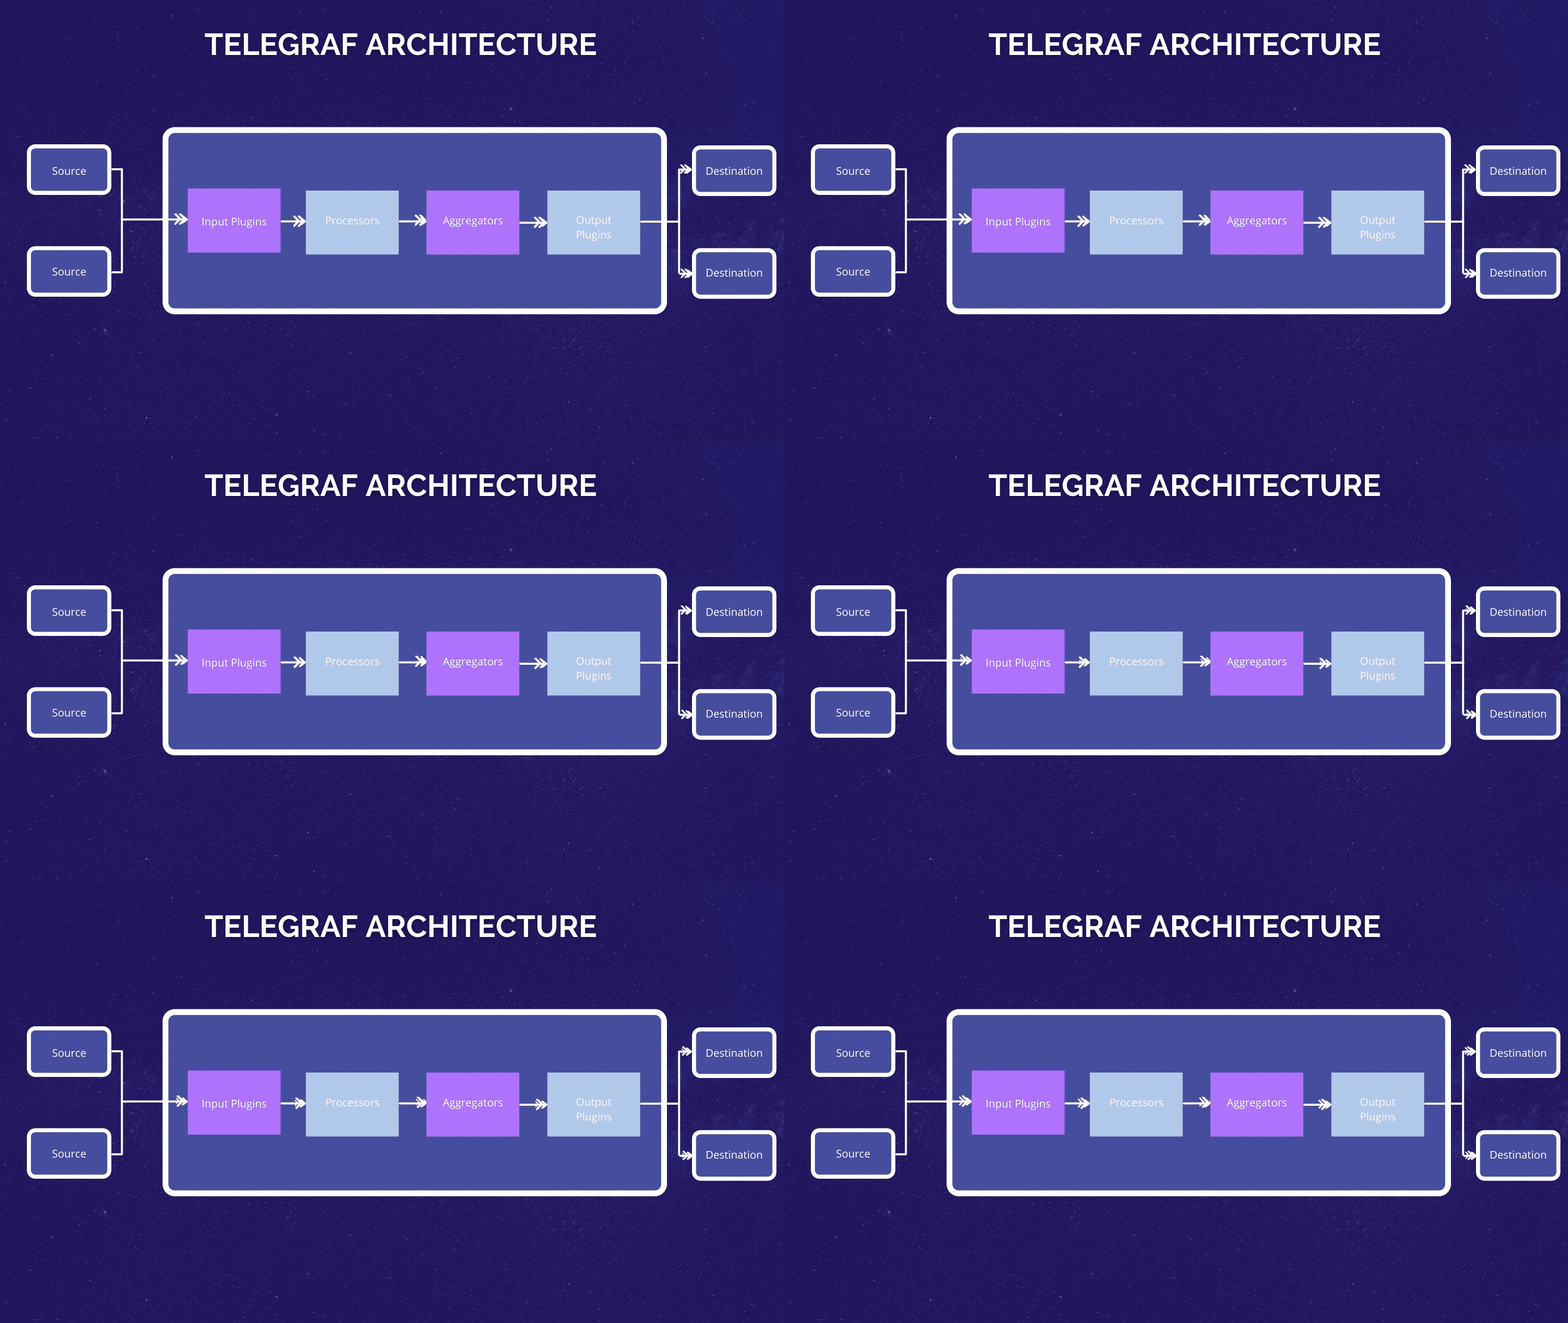
Telegraf Architecture
Most of Telegraf’s input plugin can be grouped into the following like below
Metrics from common open-source data infrastructure
Metrics from common DevOps tools and frameworks
Kubernetes and more
Metrics from common Monitoring systems
Google Monitoring and more
Low-level OS system telemetry
Netstat and more
Telegraf supports the following generic sources
File — Consume the contents of an entire file
Tail — Tail a file
SocketListener — Receive input from socket over TCP and UDP
HTTP Listener — Receive POST over HTTP
HTTP Poller — Periodically get data from a configured endpoint
Exec — Execute a process and get metrics from stdout
Execd — Execute a daemonized process
2. Download GoLang and clone the Telegraf repository
Now, we will start creating our own input plugin which will collect the statistics from Youtube. Before writing the plugin we must download the GoLang since the Telegraf is Go executable
Install GoLang on ubuntu
Use the below command to download the go binary file
curl -O https://dl.google.com/go/go1.15.7.linux-amd64.tar.gz
Once done check the sha256sum using the below command
sha256sum go1.15.7.linux-amd64.tar.gz
Once done unpack it using the belong command
tar xvf go1.15.7.linux-amd64.tar.gz
You should now have a directory called go in your home directory. Recursively change go’s owner and group to root, and move it to /usr/local
sudo chown -R root:root ./go sudo mv go /usr/local
Now we will set the Go paths, for that open the profile file using the below command
sudo nano ~/.profile
at the end of the file add the below line
export GOPATH=$HOME/work
export PATH=$PATH:/usr/local/go/bin:$GOPATH/bin
Refresh the profile using the below command
source ~/.profile
Now we will clone the influx data repo in the Go working directory
go get github.com/influxdata/telegraf
Once it is cloned navigate to the plugin directory go/src/github.com/influxdata/telegraf/plugins/where you could see the directories like below
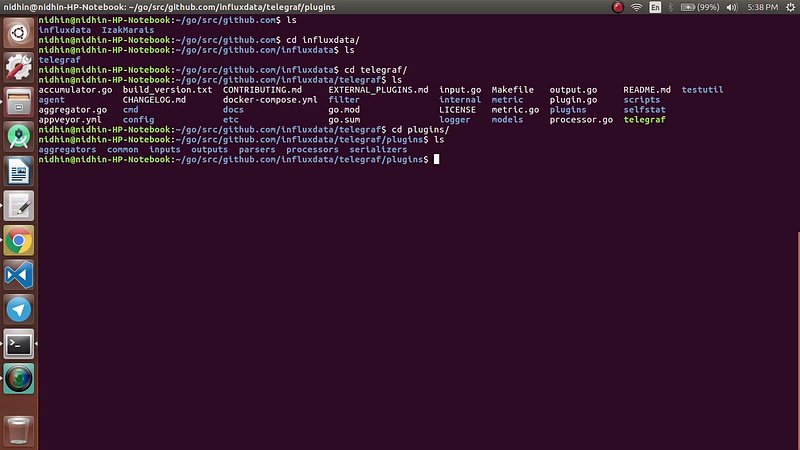
Plugins folder
Now navigate to the inputs directory and list down the plugins where you could see the list of plugins like below
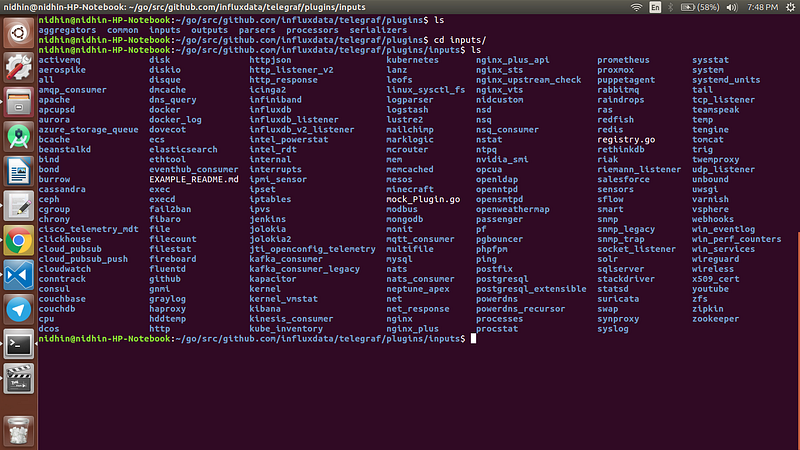
input plugins list
Now we have cloned the InfluxData repo to our local machine next we will write the logic for the custom plugin
3. Create a custom Telegraf input plugin to collect Youtube Statistics
Now we will create the custom input plugin to collect the Youtube statistics of a channel
First, create a directory named youtube using the command mkdir youtube . Once done create a new file named youtube.go
Open the text editor and add the basic skeleton for the custom plugin like below
Once the basic skeleton is created now we will add the logic to collect the metrics from Youtube based on the list of channels we provide
What we have done in the above code we have created a youtube service that will collect the API key from the input configuration file and in the Gather function we have used a loop to list down the channel-ids based on the channel-ids we will get the channel details and tags using the getFields() and getTags() functions.
Once all the metrics are collected we will add these fields to youtube_channel measurement (a.k.a table) using the below snippet
acc.AddFields("youtube_channel", fields, tags, now)
Now we have written the logic to collect the statistics from Youtube. Now we will build the Telegraf binary
Open the all.go file in telegraf/inputs/all the directory and add the youtube plugin in the all.go file like the below image
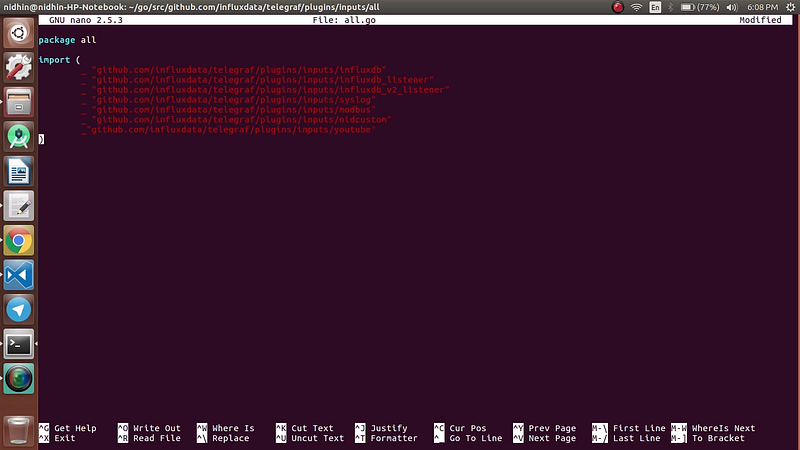
all.go file
Now save the all.go file and navigate to telegraf directory and build the binary using the command
make telegraf
Now the Telegraf binary file has been created.
4. Create a dashboard to visualize the Youtube statistics
Now we will create a telegraf.conf file and add the youtube plugin as input and push the metrics to InfluxDB
Open the InfluxDB and create a new bucket named youtube once the bucket is created, create a Telegraf configuration and download the Telegraf configuration file along with the InfluxDB token
Now open the telegraf.conf file which you have downloaded now and add the below snippets to the bottom of the configuration file
Once the above snippets are added to your telegraf.conf file run the telegraf configuration file using the below command
./telegraf --config path-of-your-telegraf.conf
Note: If the Telegraf binary file which you have created is in a different location then provide the path of the telegraf binary file like the below command
/path-of-your-telegraf-binary --config path-of-your-telegraf.conf
Now the data will be pushed to the InfluxDB like below
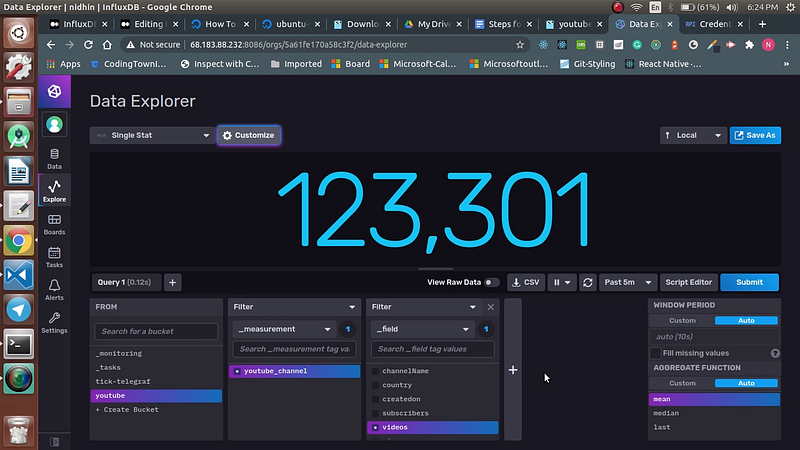
Youtube-data
Once done we can create the dashboard based on the fields we have received from the input plugin. And the final dashboard would look like below
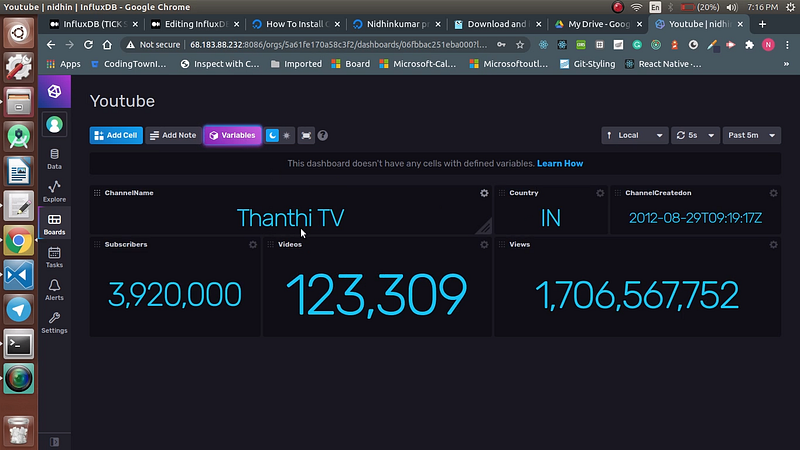
Youtube-Dashboard
5. Create a dropdown menu to change the values dynamically
Now we have created a dashboard for one channel but what if we have provided multiple channels id. In that case, we cannot create n dashboards for that we can create a variable that will list down the channel names and once a channel is created we can visualize the data of the selected channel
To create a variable click Settings -> Variable
Create variable named channels and add the channel names for the ids which we have added in the telegraf.conf file like below
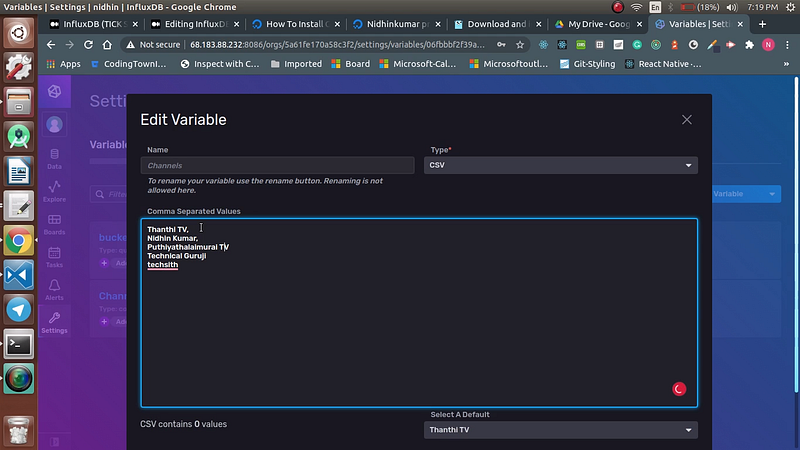
Variable-creation
Once the variable is created in the dashboard you can see the drop-down but if you change the channel it won’t make any changes in the dashboard since we have not linked it with the query.
Click on the settings of a panel in the dashboard click on the query builder and add the query like the below image
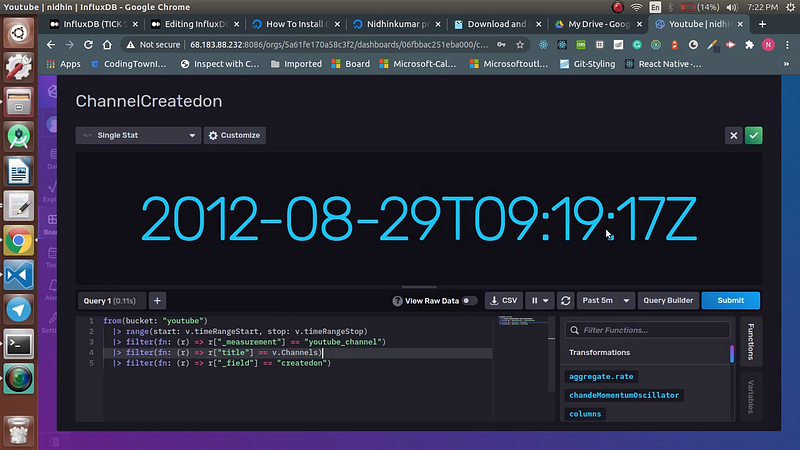
Adding a filter for the channel
Now add filters for all the panels in the dashboard. Once done if you change the drop-down value the statistics for the selected drop-down value will take place in the dashboard.
Reference Links
Installing GoLang in Ubuntu — https://www.digitalocean.com/community/tutorials/how-to-install-go-on-ubuntu-18-04
InfluxData-Telegraf — https://github.com/influxdata/telegraf
Congratulations!
You have learned how to create a custom input plugin in Telegraf and visualize those metrics by changing the values dynamically.
Now you can play around by customizing the dashboard and the input-plugin. Catch you up in a new post till then Happy Learning!


